

For anyone in the SAAS industry, you will know that B2B SAAS marketing and selling is about clear metrics and solving for blockages that inhibit growth. The SAAS Business Model means that you don’t get paid upfront for a Licence, rather you get paid overtime through a subscription. Staying alive relies on a clear focus of your sales and marketing metrics to ensure you have growth. If you have growth, then you can attract investment and continue to grow. In a previous Article, we discussed how you build The Machine, in this Article we discuss how you keep and eye on the progress of The Machine.
The Extended Funnel Principle
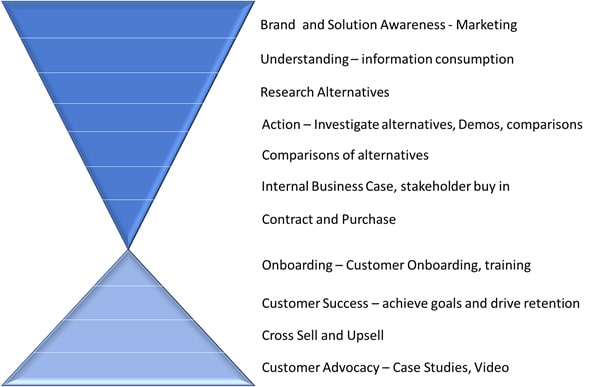
In order to Instrument the Machine, we break it down by looking at the Extended Funnel. The Extended Funnel is similar to a traditional funnel however it adds to the funnel by considering the following 4 Post Sale Funnel Metrics:
- Onboarding – more than ever, Customer Onboarding is the key to retention. If you don’t have a successful customer on-board, you and the customer lose. The customer does not get to fix the problem they were hoping to resolve, you don’t get the opportunity to retain the customer and cross sell or upsell.
- Customer Success – achieving Customer Success enables the customer to achieve their stated goals, get internal recognition, and drives overall satisfaction. For more information, please refer to the Customer Success Article.
- Cross Sell and Upsell – achieving Customer Success earlier means they can extend their product footprint and increase user adoption. The sooner the customer gets there, the faster you are able to get to the customer to purchase another product that achieves their business goals. The customer wins, you win.
- Customer Advocacy – having successful customers enable you to use them as references, Video Case Studies, independent Buyers Ratings at web sites plus more.
Here are the basics you need in place:
SAAS Metrics, Brand and Solution Awareness
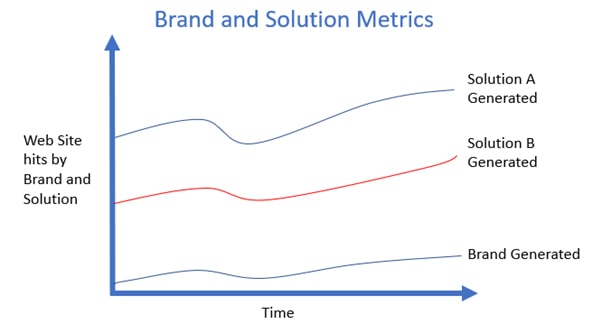
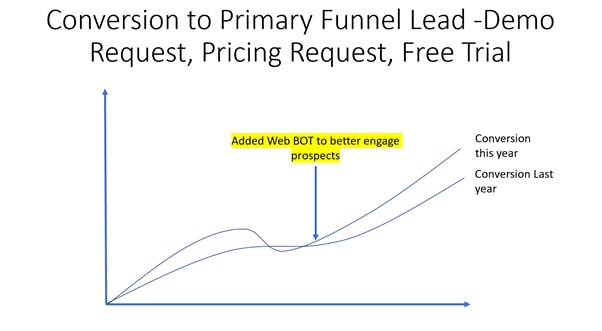
Brand and Solution Awareness Metrics are key to the top of the funnel. My personal preference is to take all the data you have and simplify it so that it becomes actionable data. For example, the following chart is a simplification of all the data that you normally get from Google Analytics and other tools:
SAAS Metrics, Information Consumption
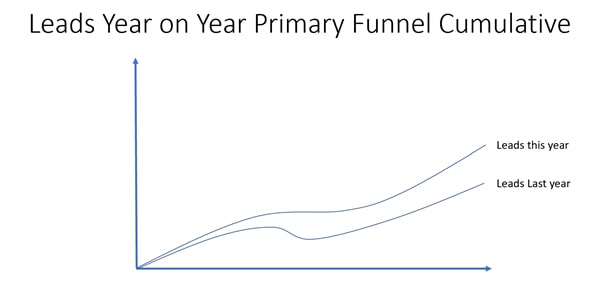
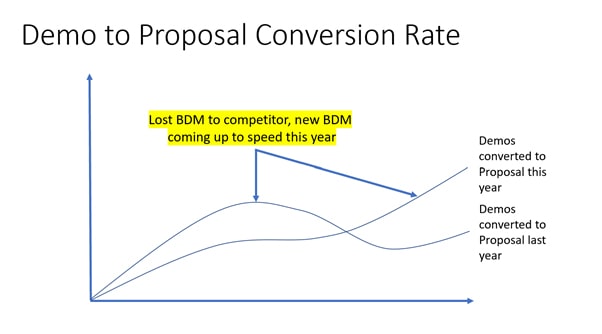
Once you have the Brand and Solution Metrics, then you need to build the Information Consumption Metrics. You want to know what Information you customers consumed most often. This is best completed by Solution or products type and again break it down to a simple chart if you can, example below:
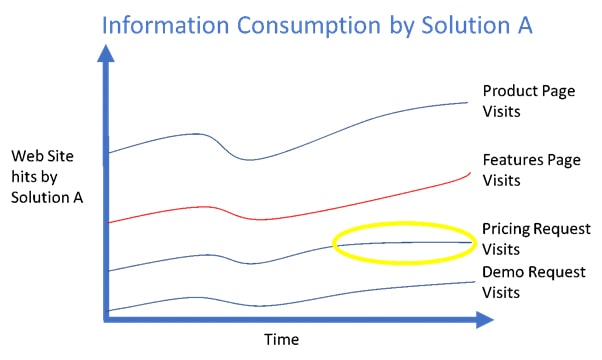
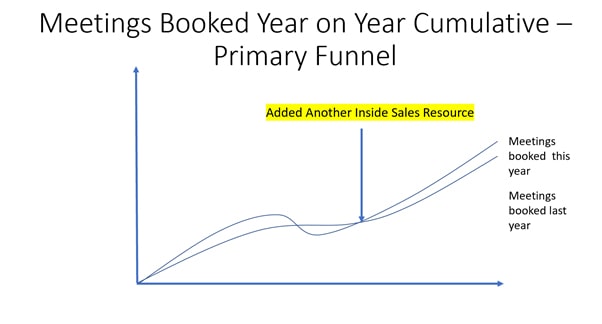
By making it simple, you can then begin a quick analysis. You are looking for the flat or declining lines on the chart. This means something has changed. Now you can get further details, has the web page been changed? Are you getting less traffic to the web page? Has the form on the web site been changed for Pricing Requests?
The actions you need to take will be clear once you examine all of the data. Trends don’t happen by mistake, this type of decline has been driven by a change, you need to investigate it.
Iterative Review
As you build each Instrument (charts and data), you need to institutionalize regular review of the instruments, here are some things you really should be doing:
- Set metrics for each of your key drivers, for example, web site visits, Pricing Requests, Demo Requests.
- Assign these metrics to key staff using Performance Management software. For example, marketing normally owns web site traffic metrics.
- One assigned, set regular weekly One on One meetings with key staff. In these meetings, get the team members to report on each key metric.
- Post key metrics to a screen that everyone can see, for example in the lunch room. Visibility means that people care about the outcomes and how they affect their peers and colleagues.
Book Monthly Management meetings where a summary of the month results for each Key Metric are presented to the entire management team, by the management team members. This ensures the teams are aware of each other team members issues and how it affects them. For example, marketing leads trending down has a significant effect on sales team members.
Summary
Start with these fundamental Top of the Funnel Metrics outlined in this article and build from here. In Instrumenting the Machine, Part 2, we will expand the Top of the Funnel level metrics and continue Instrumenting The Machine.
More Articles:
If you have a particular article you would like to see, let me know. Future Articles requested include:
- Instrumenting the SAAS Machine Part 2
- SAAS Customer Success Key Metrics
- The Secondary Funnel and how to leverage it
- Closed Lost Analysis and why it is important
Help a SAAS Buddy
Comment on your experiences and Help Out a SAAS buddy today 😊
Author: Lyle Potgieter, SAAS-Know-How.com
Amazing information you have shared in this article. This article helps me a lot and also I found some unknown information in this article. Thank you for the information.